Monitoring The Health Of A Cat Using IOT
I’ll agree with the fact that calculating a Return On Investment (ROI) or opportunity cost for anything other than an inanimate object is a bit absurd. That said, calculating the cost of ownership for pets like a cat or dog is where many including myself make an exception. We want pets to live as long as possible and invest a lot of time and money into them for the unconditional love and affection they offer in return.
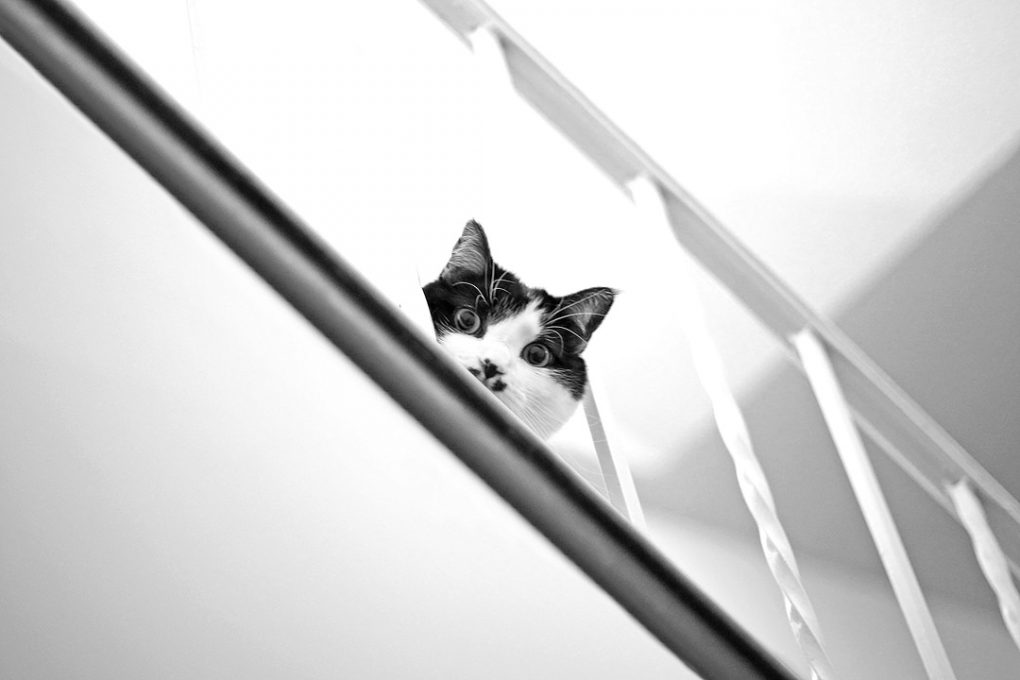
Cat’s are one of nature’s marvels. They are extremely efficient hunters and can do things that question the laws of physics. Indoor cats, however, can be fragile lions. Despite their impressive and well documented lifespan inherited by the protection from outdoor predators and diseases etc, they are very vulnerable to a number of issues related to their carpet and climate controlled jungle. Cat food available in a grocery or department store can contain primary ingredients that may increase the chances of a UTI, or Urinary Tract Infection as well as crystallization and blockage of urinary paths. Generally this is paired with lack of hydration, stress, and other factors. If not addressed immediately, this can be fatal within hours.
One of the first indicators of a potential health issue is physical activity or lack thereof. Cats are creatures of habit. For this reason, I consider this a reliable data point to observe, monitor, and alert based on. The focal point of activity I am most concerned of is the traffic going into and out of the litter box. Are the amount of visits increasing or noticeably decreasing? If so, is there an absolute to be found somewhere in the data? Let’s explore!
There are several ways to record, analyze, and output this data. For the sake of simplicity, my first goal is to record litter box usage, however I cannot rely on just the presence or absence of anything in a litter box. Often times when a UTI or blockage begins, many urination attempts are made by a cat, but perhaps none or only a few are successful. Recording just the activity in and out of the box is therefore a great metric to monitor.
I refer back to my IoT use case process and make the decision that a simple Passive Infrared (PIR) sensor will suffice. That, paired with the trusty ESP8266 platform and ESPEasy firmware will allow me to send this data into a collectible engine that can also send me alerts if need be.
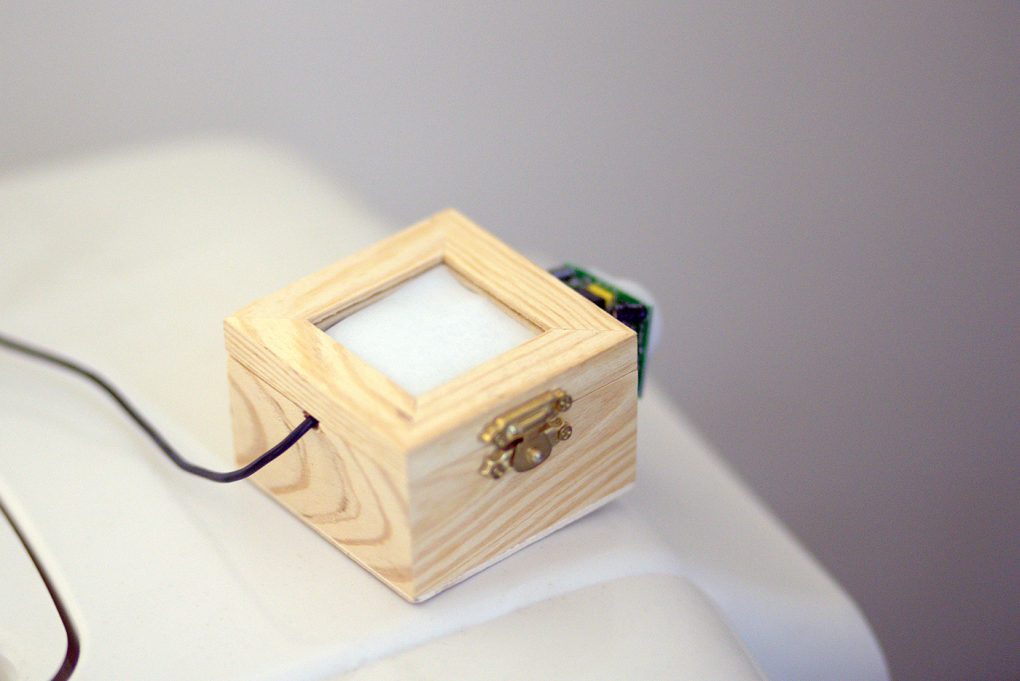
A photo of the solution placed just above the box so as to only alert based on the cat’s presence.
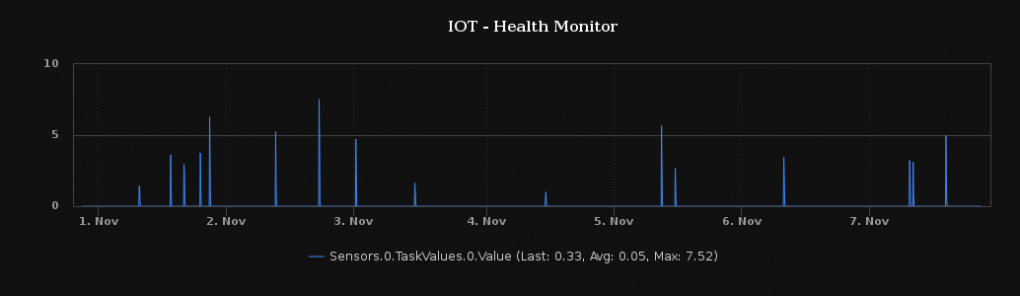
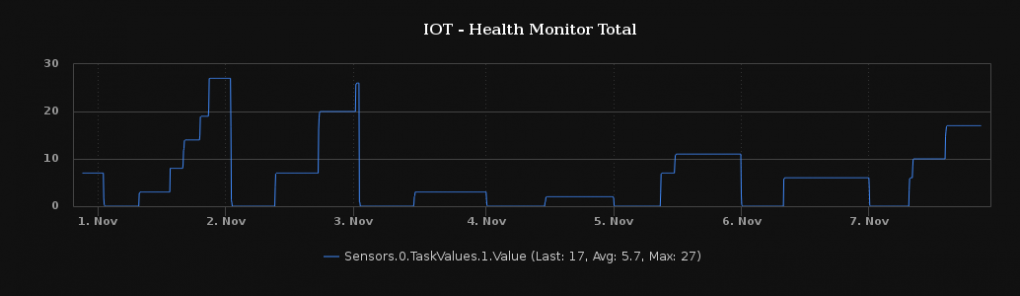
Here is what the data looks like in Nagios XI. Data is both delivered in a daily total and minute by minute breakdown so that I can analyze the data as a 24 hour summary and, if need be, visualize the frequency between visits. Alerts can then be triggered based on the values exceeding or not meeting the observed average expected behavior.
While this data is only meant to be anecdotal from a daily perspective, there will be a time when it becomes statistically significant, and the alerting engine will do its part. The day that both the totals and frequency between visits increases or decreases significantly is when I will be able to look back at this system and thank it for doing its job.
Discussing this project with fellow engineers, many insist that this simple data collection project carries with it larger opportunities that can be integrated into a collection of cat, dog, and other health monitoring systems. While I do agree, I will add that this project can get messy depending on the metrics you’re wishing to monitor and alert based on, so choosing a sensor and collection method that is easy to maintain is likely your best bet when paired with human intuition.